its just a cheesy powerpoint

But it won an Oscar. An Inconvenient Truth is an interesting film, a documentary that is a presentation.

The ideas that it communicates are vital, climate change is happening, we are almost definitley to blame.

Part of me though feels that this is somewhere we have been before, a documentary that everyone has to see, it will change the world. Yet fahrenheit 911 didn’t change the election. The world was not made a ‘safer’ place.

Do not get me wrong, I am not wanting to be seen as dissmissing either film. Both are strong films, each has the strength of their own conviction. Michael Moore’s film is just that, a Michael Moore film one that has his personality and his view of events embedded in it. AIT is more reasoned. It has the backing that only science can give. The data cannot be refuted, what is presented in this film is what is happening.

BUT, is it just a cheesy powerpoint ? (ok, I know that Al Gore sits on the board at Apple so it is not a powerpoint presentation but a Keynote one).

Has anyone yet done a critique of the film, of the presentation taking Edward TuftesTHE COGNITIVE STYLE OF POWERPOINT: PITCHING OUT CORRUPTS WITHIN‘ as a guide to what is wrong with presentations built using tools like power point?

Envisioning Global Change @ Apple Store

I have just got back from a presentation at the Regent Street Apple Store. The presentation was by geographer Ned Gardiner and animator Arlene Ducao from the American Museum of Natural History’s Science Bulletins programme.

The presentation was about the visualisations they produce for the Museum. These visualisations are used in the Museum, are syndicated across the USA to other museums, used by scientists are are available from the website http://sciencebulletins.amnh.org .
They showed three visualisations on Stratospheric Ozone, Sea Ice and Urban Sprawl.

These are based on scientific data from Earth Observatory System satellites. The one on Urban Sprawl also used survey data. Inbetween each of these visualisations, presented by Ned, Arlene demonstrated how she worked on creating these visualisations from the scientific data. She used Maya and After Effects.

Envisioning Global Change @ Apple Store

Introducing the talk.

Envisioning Global Change @ Apple Store

Arlene talks about “primitive” technique – Cezanne and Cubism, George Boole and boolean algebra.
Why do they create visualisations, rather than just use photographs or other media.

Visualisation allows for:

  • Manipulation of space.
  • Compression of time.
  • Extraction of space.

The High Definition renderings of the visualisations are distributed to other museums across the states as part of a subscription service. They download new movies on a weekly basis.

By using satellite data and visualisation techniques they are able to give a:

  • Global ‘macroscopic’ perspective.
  • Satellite vantage points and designs provide different measurements.
  • Make Global change observable.

20 – 30 years ago, earth / planetary science visualisation was done using colour by number techniques, now we can produce complex animated visualisations of what is happening to the earths ecosphere on your desktop.

These visualisations are a vital tool for the geeKyoto project, they help convey the complex science behind climate science and planetary science, developed by people who specialise in producing educational material.

Information on the data sources used in producing the visualisations is given, so you can try and make your own and you can answer questions on the sources if asked.

After the presentation I introduced the geeKyoto project to Arlene and also the concept of the Daily Climate Report, so hopefully we will hear more from the American Museum of Natural History and the team there producing this excellent work.

hackday in london

Yahoo and backstage.bbc.co.uk have announced a Uk hackday, to be held in London.

This will be a cool event where stuff will be built. I have signed up and here is a quick braindump of stuff i would like to try and build / see built / talk about:

  • viridian widgets

desktop widgets to allow me to keep a track of power usage, paper usage and other data wrangling on the physical impact of my computing on the world.

  • mypersonalkyoto

A site to really start collating, shifting and sifting my physical footprint. This links back to ideas I have previoulsy posted on my ‘occasional log‘ namely car data and boutique energy companies.

  • streetpower

another idea, to get small groups working together to generate power, aid in recycling and motivating other ideas to reduce the carbon footprint of our lives.

I’ll see if I can bring a Wattson or something similar along and see what power data I can dig up for consumption, and what other API’s to mash (when will Dopplr be open?)

Snout – Making a stand about Climate Change

From the node-l mailing list. I am going to post the press release, hopefully I will be able to make it there and see what actually happens.

Mark

——

Press Release

Snout
Making a stand about Climate Change
Using participatory sensing & media scavenging

A ‘carnival’ performance and public forum
__________________________________________________

Venue: Cargo, 83 Rivington St, Kingsland Viaduct, London, EC2A 3AY
The performance will start at Cargo and the route will include Hoxton Square and Hoxton Market
Dates/Times: Tuesday 10 April, Performance 10am, Conference 1.30-5pm.
Tube: Old St, Liverpool St
Admission: Free
Access: Limited, please call in advance for details
Information: +44 (0)20 7729 9616, www.iniva.org, institute@iniva.org
Supported by Arts Council England & Esmée Fairbairn
__________________________________________________

With increasing concerns about climate change, individuals and communities are looking for new ways to take action and make a real and lasting impact.

In the Snout ‘carnival’ performance and public forum, artists, producers, performers and computer programmers demonstrate how to create wearable technologies from scavenged media, in order to map the invisible gases that affect our everyday environment. The project by inIVA, Proboscis and researchers from Birkbeck College also explores how communities can use this visual evidence to participate in or initiate local action.

The performance will show in action two prototype Snout sensor ‘wearables’ based on traditional carnival costumes. Carnival is a time of suspension of the normal activities of everyday life – a time when the fool becomes king for a day, when social hierarchies are inverted, a time when everyone is equal. Snout proposes ‘participatory sensing’ as a lively addition to the popular artform of carnival costume design, engaging the community in an investigation of its own environment, something usually done by local authorities and state agencies.

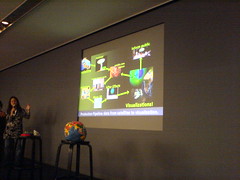
A public forum on ‘participatory sensing and media scavenging’ will be held after the performance. This will demonstrate the Snout wearables, discuss evidence collecting for environmental action and how communities can reflect on the personal impact of pollution and the environment. The forum, led by Giles Lane (Proboscis) and Dr George Roussos (Birkbeck) will look at ‘participatory sensing’ as a form of social engagement. The forum will share tactics on how to ‘scavenge’ free online services and resources, as well as exploring the relationship between information, aesthetics and design and how to make these ideas and issues accessible to more people.

Snout is a new collaboration between inIVA, Proboscis and researchers from Birkbeck College exploring relationships between the body, community and the environment. It builds on a previous collaboration Feral Robots (with Natalie Jeremijenko) to investigate how data can be collected from environmental sensors as part of popular social and cultural activities.

____________________________________________________
Editors Notes
____________________________________________________

Credits
Snout is a collaboration between inIVA, Proboscis and Birkbeck College’s School of Computer Science and Information Systems, supported by Arts Council England and the Esmée Fairbairn Foundation.

inIVA creates exhibitions, publications, multimedia, education and research projects designed to bring the work of artists from culturally diverse backgrounds to the attention of the widest possible public. (www.iniva.org)

In 2007 Rivington Place, inIVA and Autograph ABP’s new contemporary visual arts space, will open in the heart of East London. Supported by the Arts Council England Lottery Capital 2 Programme, this will be the UK’s first permanent home for culturally diverse visual arts and photography. Barclays Bank plc is the Rivington Place founding corporate partner, contributing £1million towards the development. This innovative partnership reflects Barclays’ history of supporting positive social change and making a real and lasting difference to the diverse communities in which it operates. (www.rivingtonplace.org)

________________________________________________
For press information and high resolution images please contact
Josie Ballin on +44 (0) 20 7729 9616 or josie@iniva.org

the daily climate forecast

yesterday (14th February 2007) i was lucky enough to attend the 3rd Design Futures conference, held by the BBC’s Design Forum. yes it is for BBC staff only but the ideas are so important that they need to be spoken about elsewhere.

the day had 5 world class speakers, one of whom was John Thackara, of ‘In The Bubble‘ and ‘Doors of Perception‘ fame. His talk was about content, an underlying theme of the day. His focus was content in the face of global, catastrophic climate change.

by starting with a distillation of Al Gore’s presentation to four slides he then went on to present some of the work that is happening in DOTT07, or Designs of the Time. this is happening in the north east of england and is looking at design and everyday life, in the context of climate change.

he then gave four ideas that he felt that the BBC could help build and communicate. all four are good and important and i can see ideas for all of them but at the moment i want to concentrate on one which i feel is visibly most appropiate for the geeKyoto project.

‘the weather report’

on prime time television, every day we have meteorologists present what is essentially a jargon ladden, scientific based prediction and report on the current and expected weather. most people watch it and note the graphic over their area, the rain or the sun maybe paying attention to the time as well. does anybody really understand what they mean by the bands of high (or low) pressure and why it affects the weather over their heads?

so the challenge is can we present the state and predictions of the climate, globally and locally. all the science and politicians state that it is going to get worse before it gets better and if we do not do anything it will just get worse.

can the BBC do this? well yes i think it can but so could geeKyoto, could we make a ‘the daily climate’ meaningful and easy to understand in as ambient and easy a way as possible?

creating a new presentation

how do you start building a presentation to explain what is going on?

how do you tell people, who might not want to hear that they will have to change how they live, that they will have to change to survive?

how should they change?

it is no easy task, though nothing of import is ever easy. in the news now we all hear that climate change is happening and that we have caused it. unless people are told how to chnage though, they will just assume that the politicians and big business will save the day.

do we start with the earth, seen from space with clouds our blue marble or do we start with a pale blue dot viewed through the rings of saturn? or maybe we start with a picture of our homes, the places where we live, the places where we as individuals have to make a difference.

a lot of us have to start telling the story and doing the story, not everything will be big and world changing mostly it will be small, local but always important.

What is geeKyoto?

It is a project to :

  • create an open source presentation stack to do the same job as Al Gore’s ‘an Inconvenient Truth’. Why? Well he has promised to open this up under a Creative Commons licence but its not happened yet. Besides we need to tweak and change the presentation to each audience.
  • create onlne tools to help combat the global crisis. Widgets that keep the power used by our computers visible, how to track the environmental impact of the stuff we surround ourselves with. We need to keep ‘viridian’ cool visualisations that engage, challenge and excite.
  • Develop guidelines for creating an Urban Centre of Alternative Technology. To show and help everyone living in our towns and cities what they can do.

geek + kyoto = ?

It’s all about what we can accomplish. Did you go see ‘An Inconvenient Truth’? Have you read the ‘Worldchanging: A users guide to the 21st century’ book? Do you recycle?

There is so much that needs to be done and so much to distract us.

If you have not done any of the above, then I do urge you to do them. The film is interesting, the book an evolution of the ‘Whole Earth Catalogue’. Both are inspiring so go and get inspired and then come back to geeKyoto and lets see what else we can do.

design for everyday life